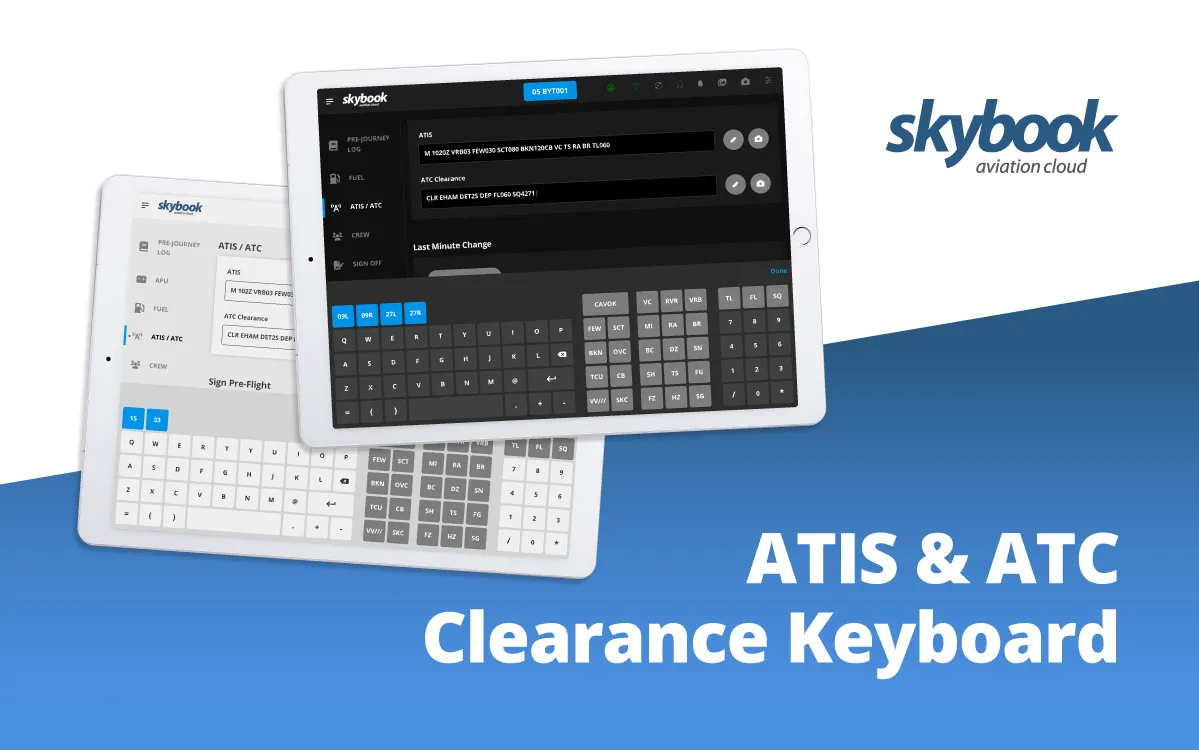
EFB Administration Configuring Electronic Flight Bag

Airlines are increasingly looking to digitally transform their flight operations with an efficient flight briefing process by opting for a digital EFB solution. This means an abundance of flight data is easily accessible!
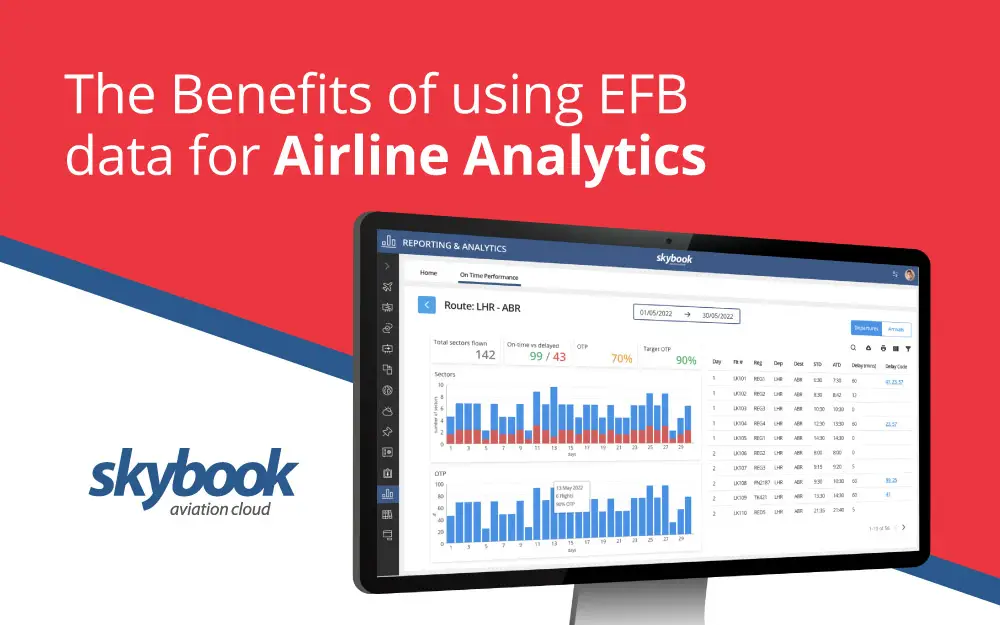
Why let that EFB data go ignored, when the airline analytics can be harnessed to provide some advantageous pre-flight to post-flight insights?
(Download product sheet)
Data collected from our electronic flight bag is transforming flight operations ability to monitor things like on-time performance and delay code data. Along with upcoming fuel usage, de-icing and more, all via the skybook Reporting & Analytics module.
Here are some great benefits to collecting airline data analytics…
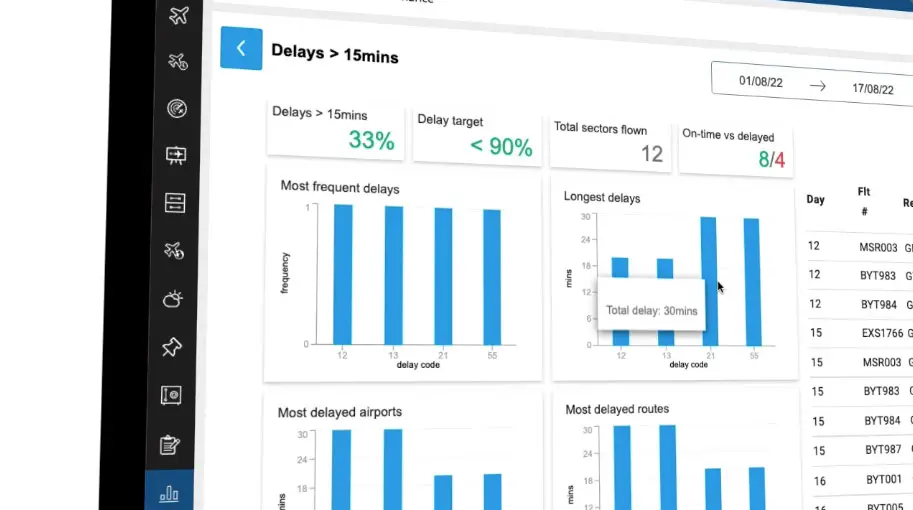
By using the skybook EFB and flight dispatch system, airlines can instantly gain access to delay code data analytics and OTP reports. Having the ability to easily analyse which delay codes are proving to be the costliest and cause the most problems, helps operation managers to make informed improvements for the airline.
Reducing the amount of preventable delays from happening, will inevitably mean an improved OTP; leading to fuel savings, staffing and significant cost savings too. Such as less passenger compensation claims for late flights!
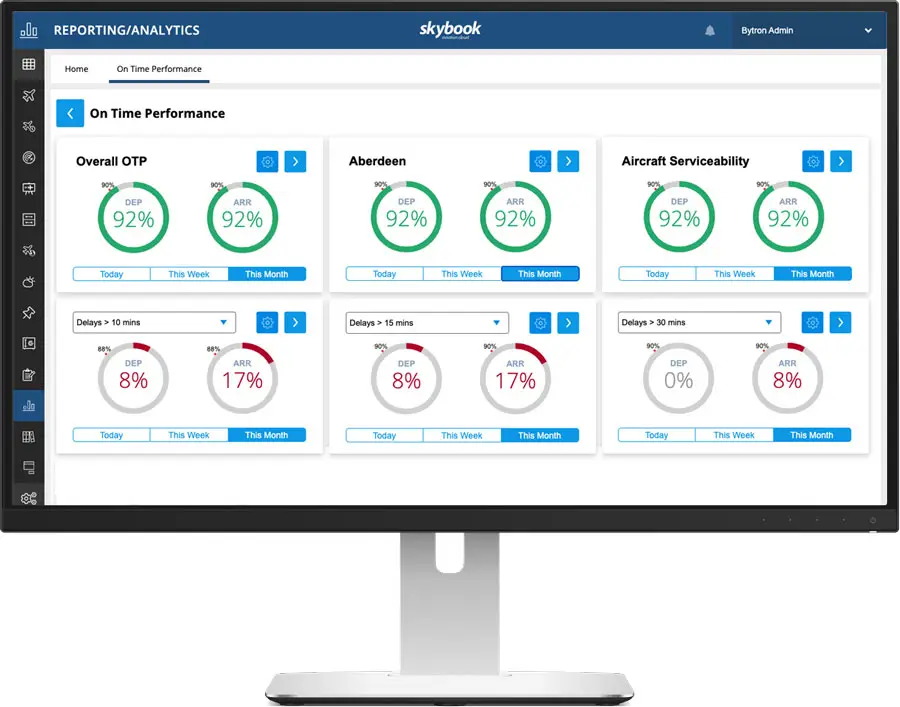
With an acceptable on-time performance for the airline industry at around 80% or above arriving within 15 minutes of their scheduled arrival time; it is vital that your OTP data is accurate and instant so problems can be noticed quickly.
Manual data gathering from multiple departments to estimate the OTP is no longer needed, which saves time and additional resources for the airline. By having instant access to accurate EFB data from flight deck, makes a huge difference to the process.
skybook effectively becomes your single point of truth for airline analytics and flight data management!
Delving deeper into the delay code data can help airlines to make significant changes which leads to the overall goal of maintaining customer satisfaction and loyalty to the airline. Afterall, less flight delays mean passengers don’t miss flight connections and they remain happy customers.
Finding trends in data such as the most delayed airports, enables airline management to find out why certain airports might be underperforming. KPIs can even be set to see if things improve at the airport over a set period of time.
Let’s not forget about the best performing flights, routes and airports!
Using airline analytics means you can spot where time is being saved and understand where the most efficiencies are. Analysing what is currently working well can help to bring improvements to all areas of the airline.
Other delay analytics include: most frequent delays, longest delays, most delayed routes, on-time vs delayed and departure & arrival comparisons.
Another benefit to having access to all the airline data analytics means that over time you can view all the historic data that is also stored within the skybook record vault. The more data that builds up over time, the easier it is to notice historic trends to use as a basis for future developments and improvements.
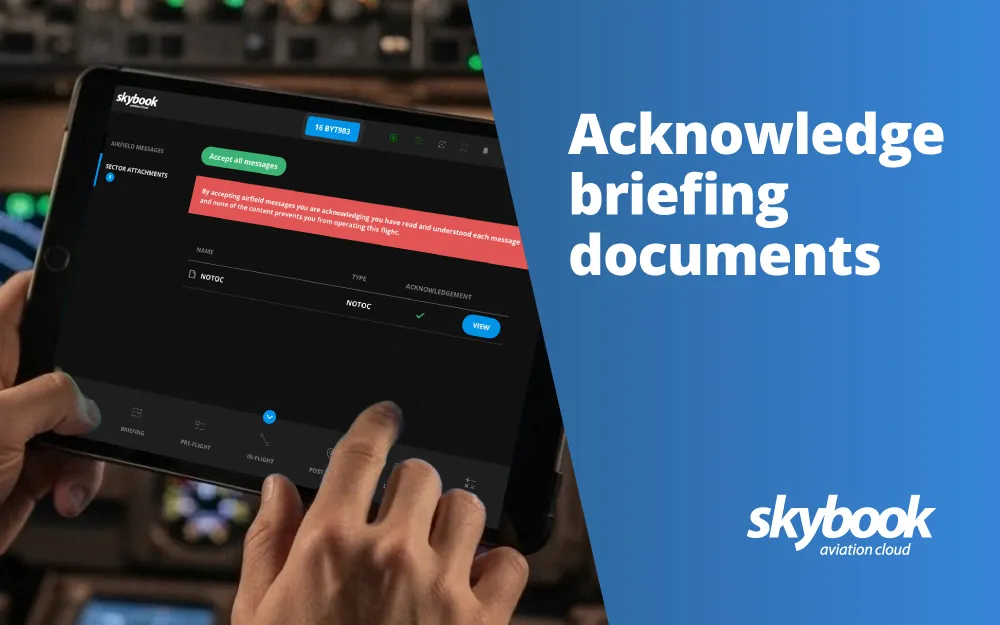
Having accurate flight data at all times, in one place ensures that the airline is compliant with aviation regulations and if any of the data was needed for an airline audit or critical emergency, it is easily obtainable. It is also easy to download all of the data for sharing purposes, or reporting to anyone else.
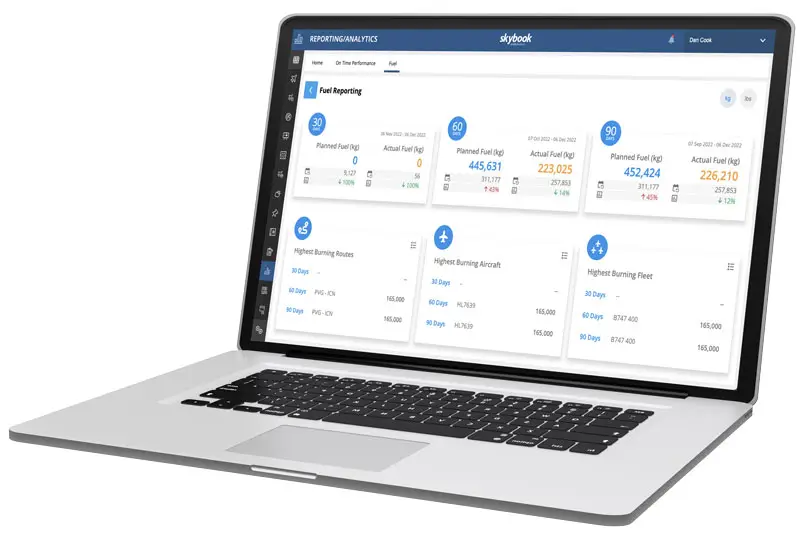
Aircraft fuel data from the skybook electronic flight bag is available to analyse in-depth via the Fuel Dashboard.
Using the mandatory inputted fuel information from pre-flight to post-flight; the fuel analysis dashboard captures data such as planned and actual fuel data over a 30, 60 and 90 day period.
The aircraft fuel data can be analysed futher based on highest burning routes, aircraft or fleet. To help with route planning processes, the graphs show all current airline routes and which routes are burning more fuel or less over different time periods.
You can also view a more detailed route report showing data such as the number of flights, total flight time and fuel comparisons to the previous year.
The Fuel Dashboard helps airlines to accurately measure how much fuel is being used and saved, in their goal to become more carbon neutral. Read more in depth about our aviation fuel dashboard...
Collecting and using flight data analytics effectively in the airline industry, is going to be what makes the difference for successful airlines trying to maintain performance and improve emission targets!
Find out more about skybook Reporting & Analytics and arrange a demonstration of skybook today.