EFB Administration Configuring Electronic Flight Bag

Updated 9th February 2026
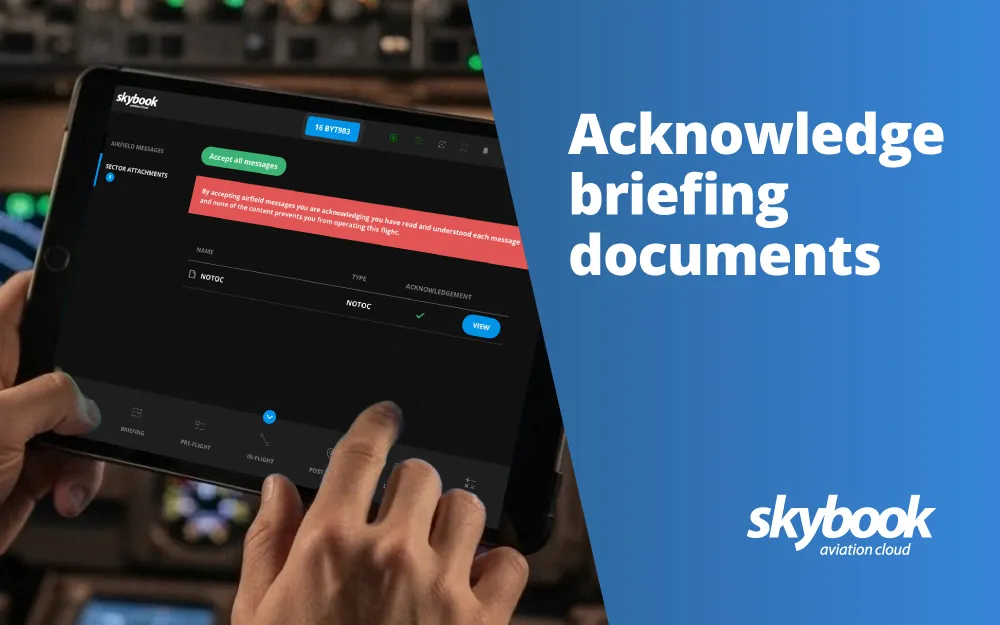
Reporting & Analytics provides commercial airlines with flight data analysis that is automatically collected from the electronic flight bag journey log data.
Fuel costs remain one of the largest operating expenses for airlines, which makes understanding planned versus actual fuel performance essential for cost control, operational efficiency and sustainability.
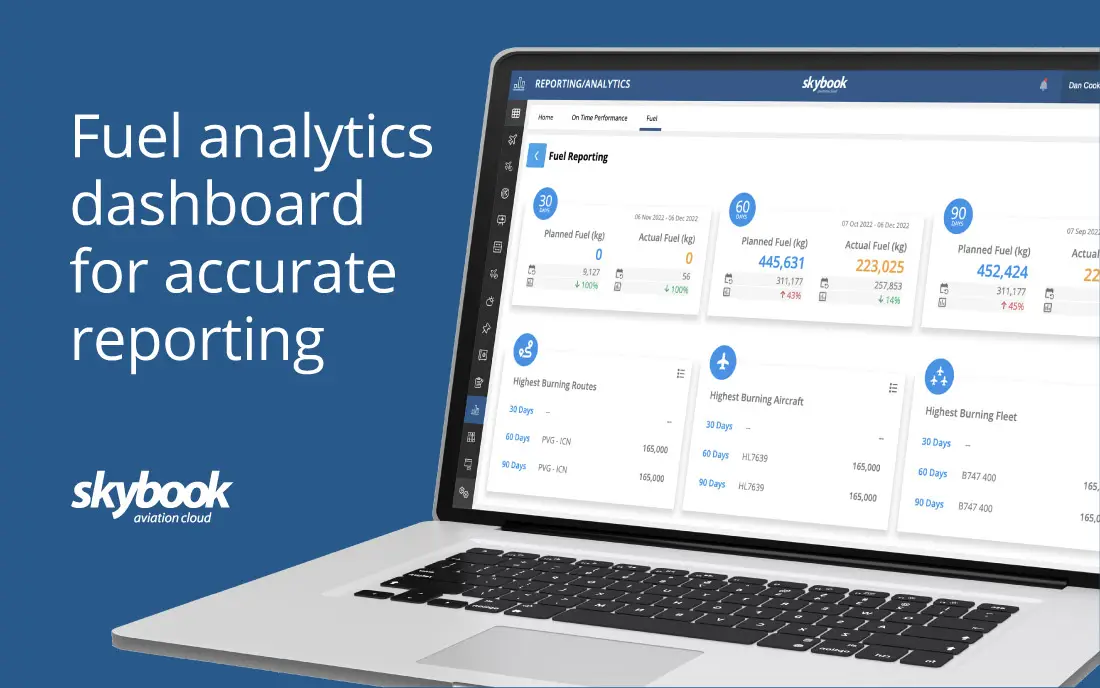
The latest addition ‘Fuel Dashboard’ provides operators with an extensive overview of flight data such as total planned fuel and actual fuel usage; shown in either kg or lbs.
Providing airlines with a stronger awareness of their fuel consumption, comparing aircraft performance and helping inform future fuel saving opportunities.
By turning raw EFB journey log data into actionable insights, the Fuel Dashboard helps operators identify inefficiencies and make smarter fuel planning decisions.
The fuel dashboard is part of our skybook ground portal. Bringing huge efficiencies to dispatch and flight ops teams, whilst more importantly improving safety for airlines.
Operators no matter what size or type of aircraft, can use the aviation fuel dashboard to gain a greater awareness of a range of fuel analytics, such as:

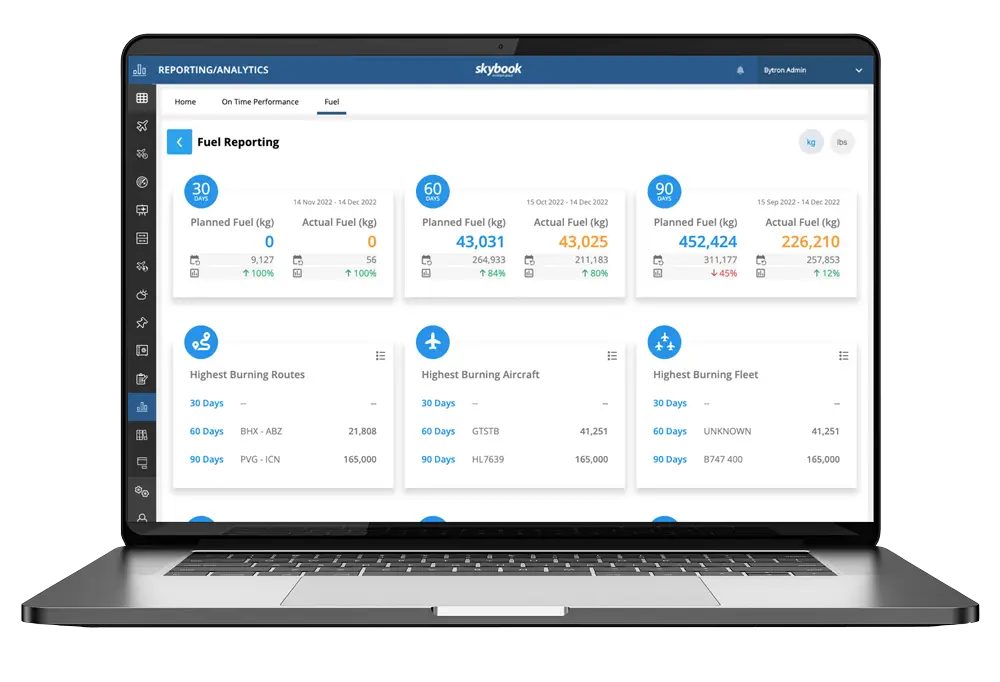
Analyse fuel usage for your whole flight operations over a 30 day, 60 day and 90 day periods; as well as comparing to the same period the previous year.
Comparing this data helps in decision making, providing the opportunity to revise cost estimates and refine future fuel usage.
For example, if certain routes consistently burn more fuel than planned, dispatch teams can investigate factors such as weather deviations, inefficient routing, or operational constraints.
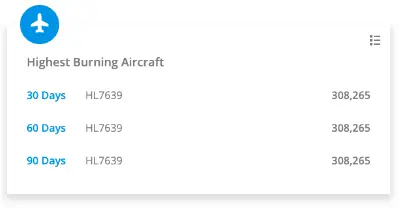
The highest burning routes, aircraft and fleet provides a useful overview of up to 90 days. Helping to find trends such as certain aircraft or types of aircraft that may be excessively consuming fuel.
There might be obvious routes that are burning too much fuel, which could be down to flights continuously deviating from their planned position, or having to navigate to alternate airports because of high risk NOTAM and weather alerts.
This visibility allows airlines to spot recurring performance trends, identify aircraft that may require closer review, and prioritise fuel optimisation opportunities.
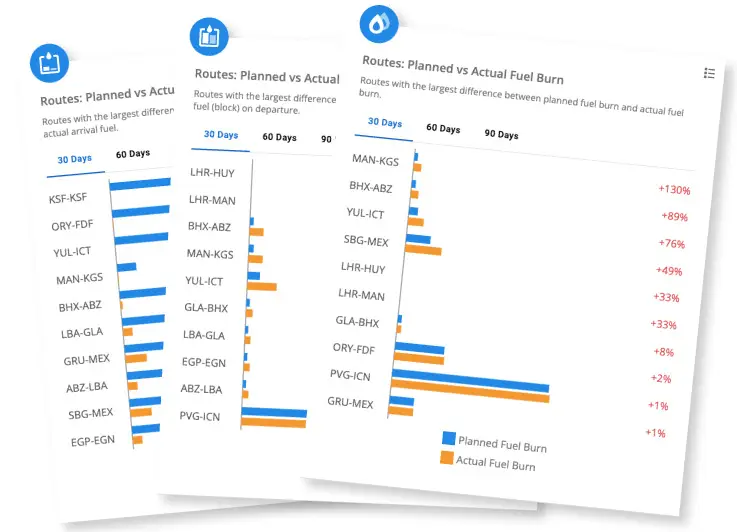
Route fuel usage data can be further analysed to compare Planned vs Actual fuel by:
The route fuel data can be analysed even further, with data such as total flight time and compared to the previous year’s fuel burn.
This level of insight supports more accurate flight planning, better forecasting, and continuous improvement across fleet operations.
Here's a seperate article about how electronic flight bags contribute to fuel efficiency.
Anyone that has access to the skybook ground portal can be set as a user to be able to view all of their airline fuel analytics. The fuel dashboard data can also easily be downloaded to a CSV file for sharing with other stakeholders.
Rest assured, all of your historic flight data which includes fuel and other analytics such as OTP & delay analysis; is safely stored within the skybook record vault. Here’s an article about some of the benefits of using flight data analytics.
This makes it easier for airlines to collaborate across departments, support sustainability reporting, and integrate fuel performance data into wider operational decision-making.
Analysing accurate fuel data from the EFB will make a difference to airlines that are trying to improve fuel performance, improve emission targets and save money.
With the right analytics in place, operators can reduce unnecessary fuel burn, improve cost control, and strengthen compliance with emissions and efficiency initiatives.
Find out more about Fuel Dashboard part of skybook Reporting & Analytics.