EFB Administration Configuring Electronic Flight Bag

Updated 5th February 2026
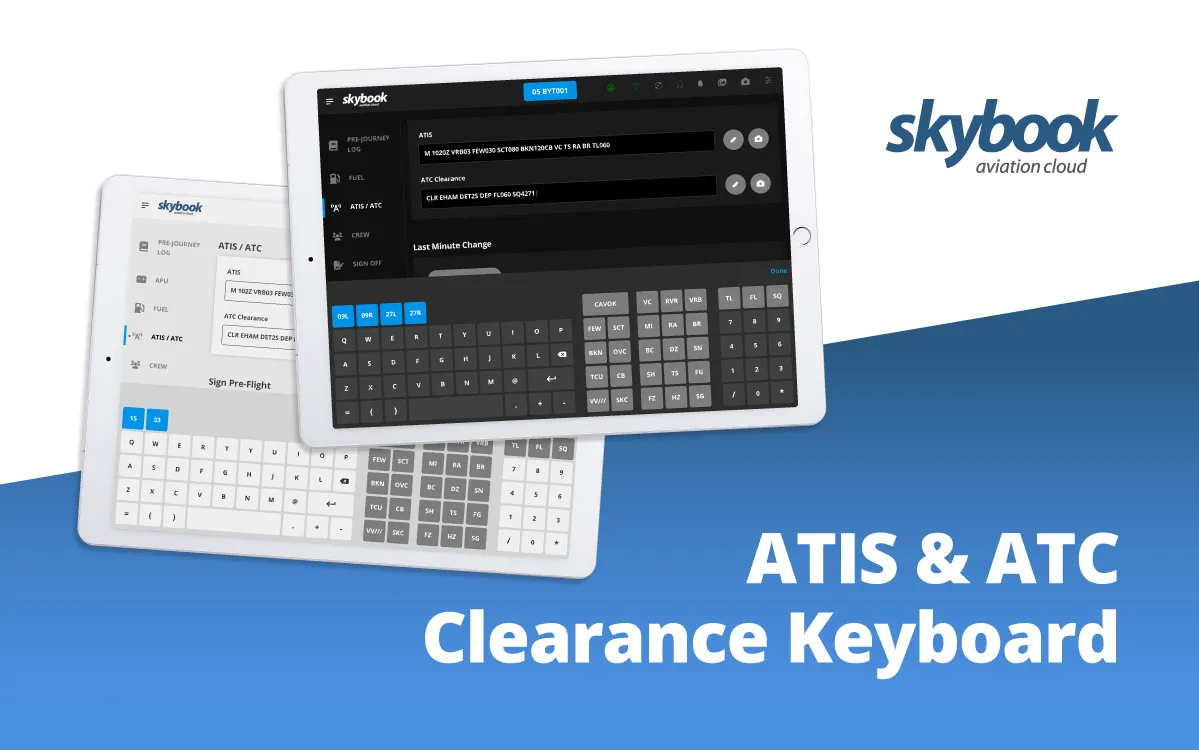
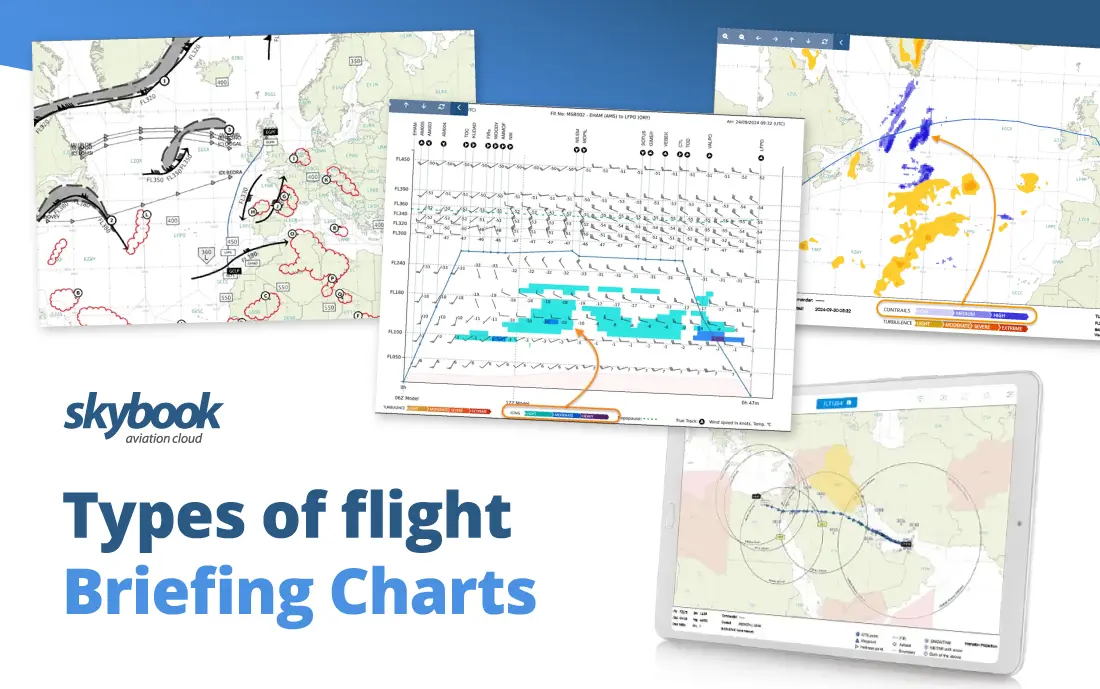
In this article, you can see some of the types of aviation weather briefing charts that skybook generates as standard for airlines, helping crews make safer, data-driven decisions during pre-flight planning.
Weather briefing charts are a core element of pre-flight preparation, helping pilots visualise atmospheric conditions, anticipate hazards and make routing or altitude adjustments to maintain operational safety and efficiency.
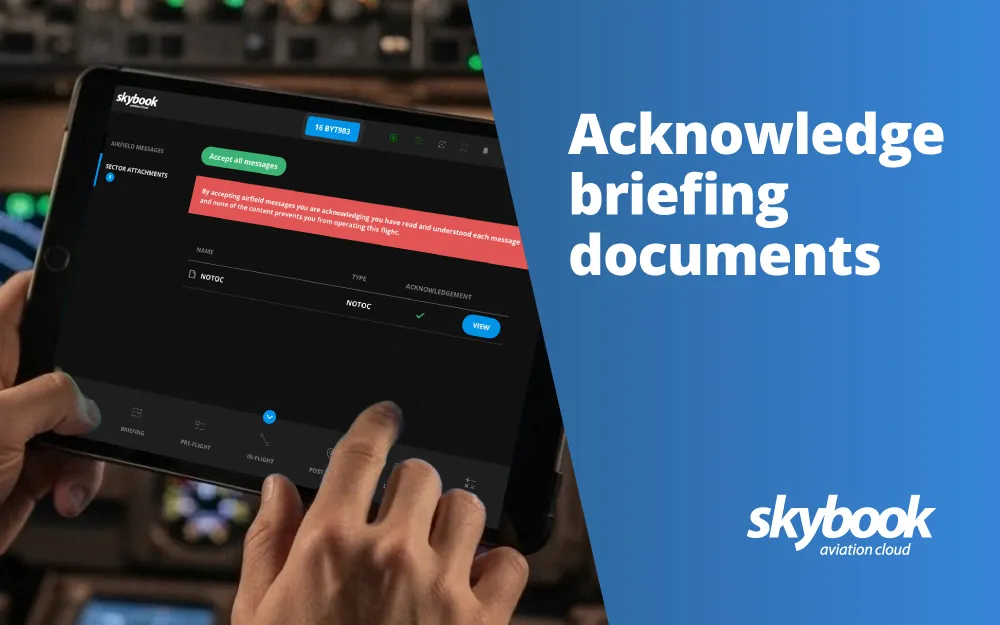
When a briefing pack is automatically created and sent to the electronic flight bag (EFB), these charts provide crews with up-to-date route and weather information, saving time and reducing the risk of errors.
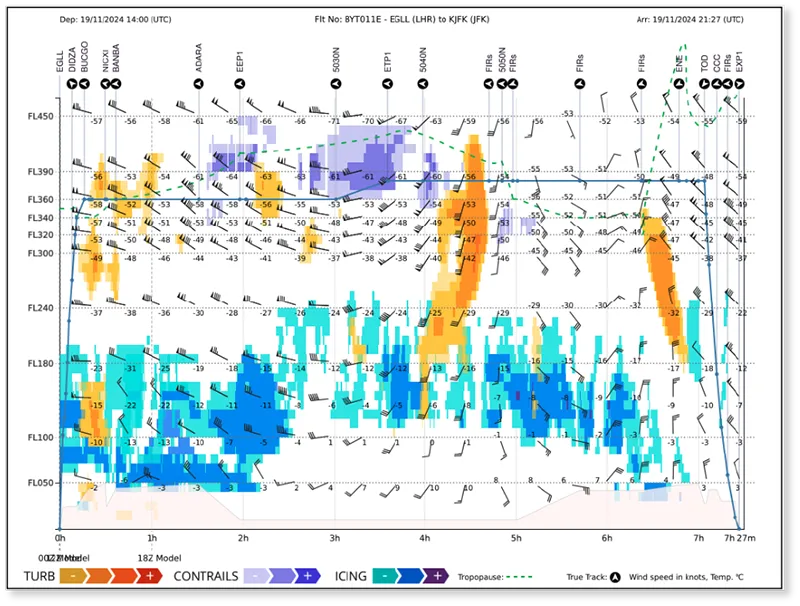
Our turbulence charts are viewable at multiple flight levels for an improved awareness of potential light, moderate, severe or extreme turbulence.
These charts also include AI-based contrail information information using Google’s predictive data, allowing flight crews to see where persistent contrails are likely to form. This helps pilots avoid contrail-heavy routes and reduces the environmental impact of aviation.
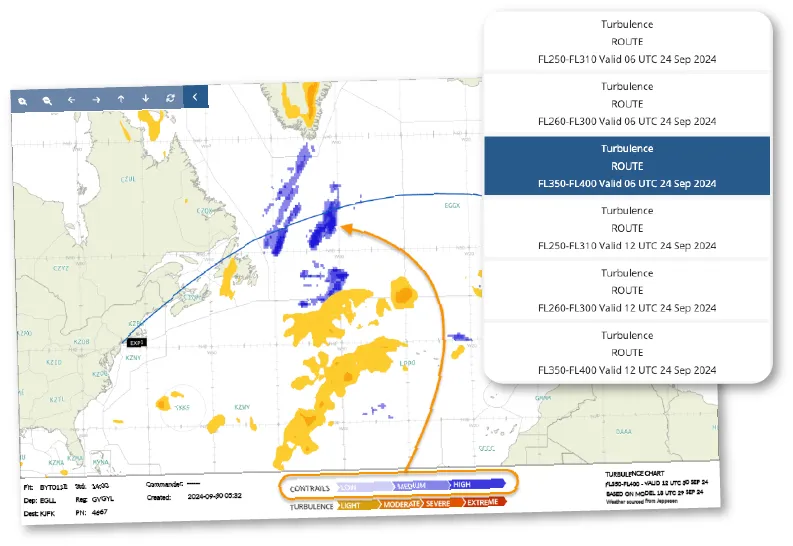
The predictive contrails extend to vertical profile charts, highlighting when a route passes over, under, or through areas of significant contrail activity, enabling pilots to adjust flight levels and routing proactively.
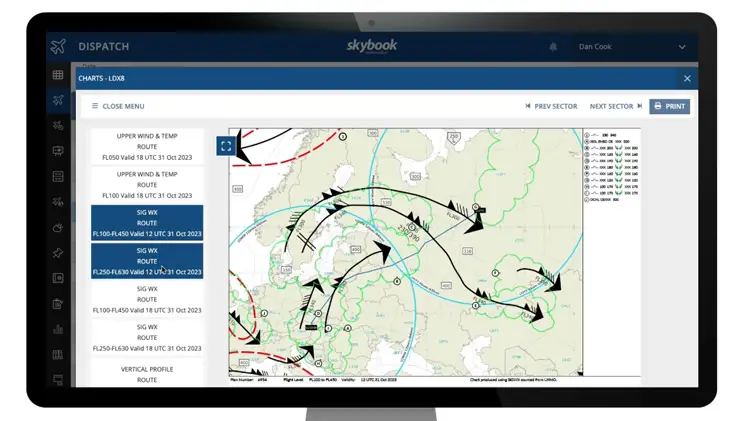
Our Significant Weather charts indicate weather activity in increments of thousands of feet (e.g., FL100–FL450), showing conditions for flight levels 10,000–45,000 feet.
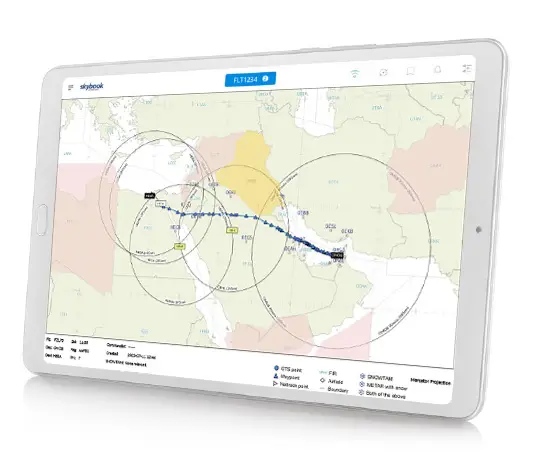
SIGWX charts also feature range rings showing distances from airports or navigational waypoints, allowing pilots to quickly assess how weather may impact route planning or ETOPS decision-making.
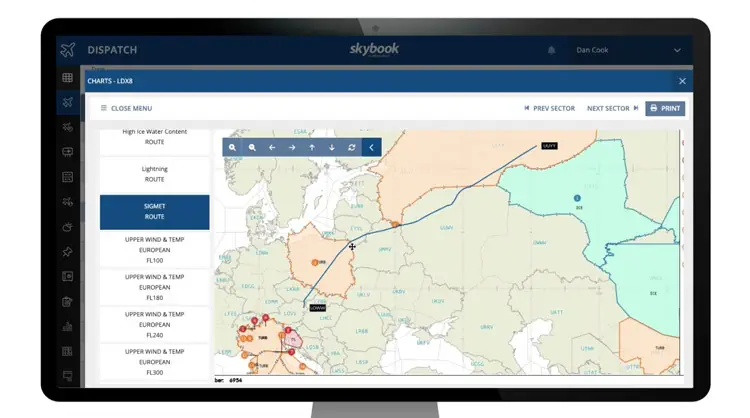
SIGMETs (Significant Meteorological Information) provide crucial alerts regarding severe turbulence, icing, volcanic ash clouds, thunderstorms, and other hazards.
In skybook, SIGMET charts are colour-coded by type and labelled numerically based on proximity to the flight route, helping crews prioritize response actions and maintain compliance with aviation safety regulations.
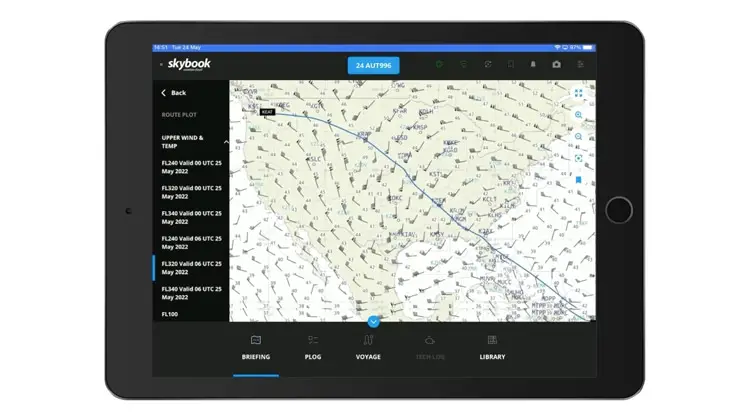
These aviation briefing charts provide wind speed, direction, and temperature at different flight levels, including wind barbs for visual direction/speed and temperature readings at specific altitudes.
Upper wind charts help understand jet streams and air mass movement, while upper temperature charts indicate atmospheric instability, storm formation, and potential turbulence; critical data for route optimization and flight safety.
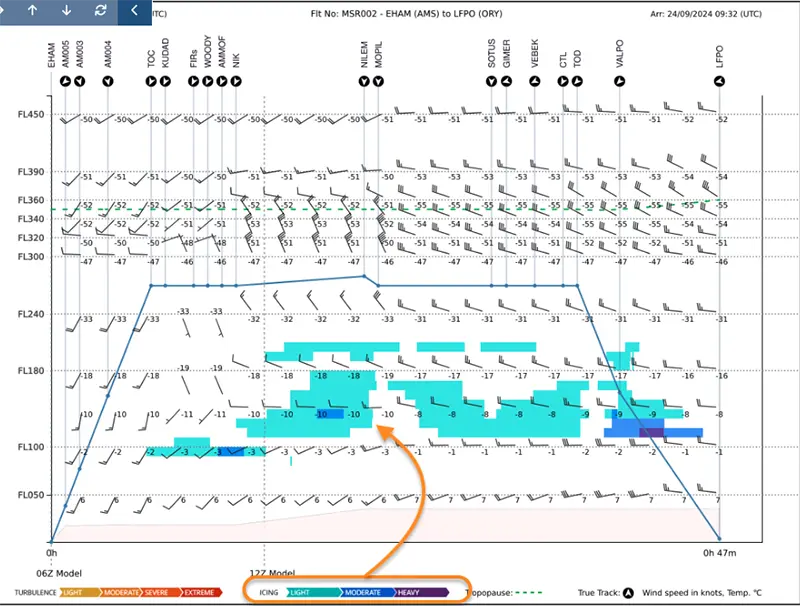
skybook’s vertical profile charts combine turbulence, icing, and contrail data, colour-coded by severity.
Wind, temperature, tropopause, magnetic and true bearings are also displayed along multiple points of the route.
These charts allow pilots to anticipate in-flight conditions and adjust flight levels proactively to improve comfort, efficiency, and safety.
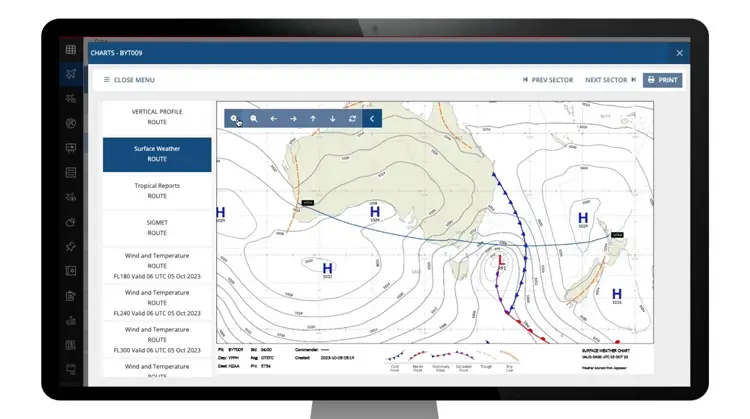
The surface analysis chart shows high and low-pressure areas, fronts, and general wind patterns, with pressure readings in millibars.
These charts support pre-flight planning decisions such as departure routing, fuel planning, and selecting optimal altitudes to avoid adverse surface weather.
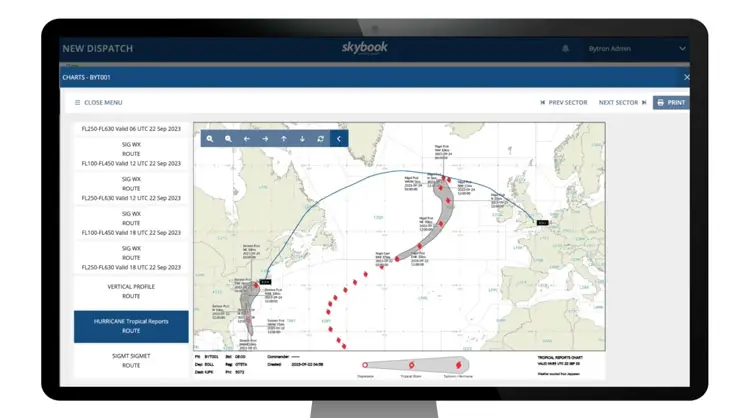
These charts depict hurricane paths, storm names, direction, speed, and time/date stamps.
They are essential for transoceanic or tropical operations, enabling early route adjustments to avoid hazardous weather.
These charts highlight areas where ice crystal concentration is high (below -20°C).
Monitoring HIC zones is vital as ice crystal aggregation can impact engine performance, informing fuel planning, route adjustments, and safety measures.
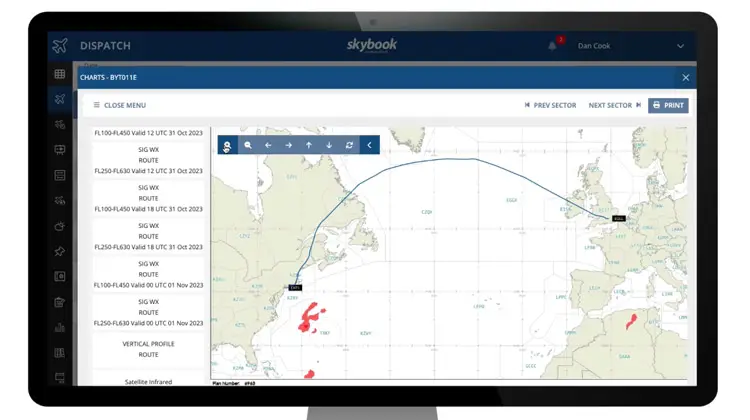
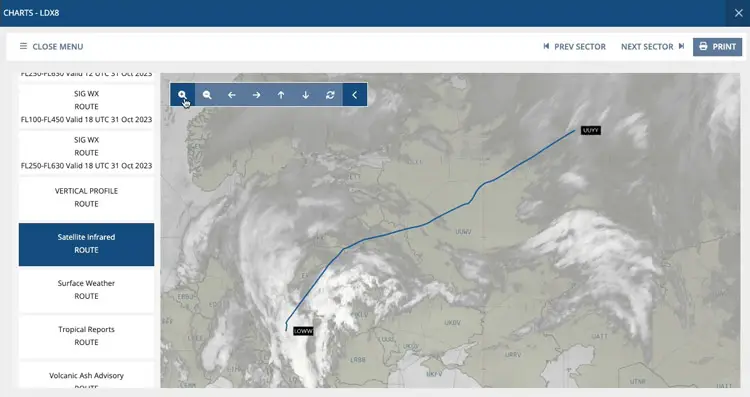
Infrared satellite charts display cloud coverage day and night, indicating cloud top altitude and whether clouds may exceed the operating ceiling.
Satellite imagery is especially useful for situational awareness in volatile weather conditions, enhancing decision-making for altitude and routing adjustments.
Route plot chart – shows flight waypoints and range rings.
Volcanic ash chart – highlights ash clouds along or near the route.
Lightning chart – identifies electrical storm activity along the flight path.
| Chart Type | Purpose / What It Shows | Operational Decision Points |
|---|---|---|
| Turbulence & Contrail Charts | Turbulence at multiple flight levels; AI-based contrail predictions | Route adjustments to avoid severe turbulence; reduce contrail-heavy paths; fuel efficiency planning |
| SIGWX (Significant Weather) Charts | Broad weather forecasts for FL100–FL450; range rings from airports/waypoints | Altitude planning; route optimization; assessing en-route hazards |
| SIGMET Charts | Alerts for severe weather hazards (turbulence, icing, volcanic ash, thunderstorms) | In-flight route or altitude changes; compliance with operational safety regulations |
| Upper Wind & Temperature Charts | Wind speed/direction, temperature at flight levels; jet streams | Optimal flight level selection; anticipate turbulence; fuel planning; storm avoidance |
| Vertical Profile Charts | Combined turbulence, icing, contrail, wind & temperature along route; tropopause, bearings | Flight level adjustments; route planning; in-flight risk assessment |
| Surface Weather Charts | Pressure systems, fronts, wind patterns at the surface | Departure planning; alternate airport selection; fuel and time management |
| Tropical / Hurricane Charts | Hurricane paths, speed, direction, and timing | Route diversion; flight cancellation or delay decisions; ETOPS planning |
| High Ice Water Content (HIC) Charts | Areas with high concentrations of ice crystals (< -20°C) | Engine performance monitoring; route or altitude adjustments; safety precautions |
| Satellite Infrared Charts | Cloud coverage day & night; cloud tops altitude | Flight level selection; route adjustments to avoid clouds exceeding operational ceilings |
| Other Charts | Route plot, volcanic ash, lightning | Waypoint planning; risk avoidance; emergency response planning |
| Restricted/No-Fly Zones | Color-coded areas (red = no-fly, amber = restricted) | Flight path selection; regulatory compliance; airspace avoidance |
Where relevant our pilot briefing charts display a quick-reference key in the bottom right corner.
Restricted areas and no-fly zones are colour-coded (red = no-fly, amber = restricted), allowing pilots to quickly identify areas to avoid.
Flight crew and operations use skybook aviation briefing charts to make informed decisions about flight routes (such as ETOPS), altitudes, and strategies for avoiding adverse weather conditions.
By integrating automated weather charts into the EFB, crews gain real-time situational awareness, reduce manual workload, and comply with regulatory briefing requirements.
For more information be sure to get in touch or learn more about skybook.
You might also find this article useful:
Is your flight brief automated?