EFB Administration Configuring Electronic Flight Bag

Data visualisation aids the discovery of what your data means in a visual concept. It can often be difficult to understand what your aviation data means and to analyse the trends in order to see where improvements can be made or what is working well.
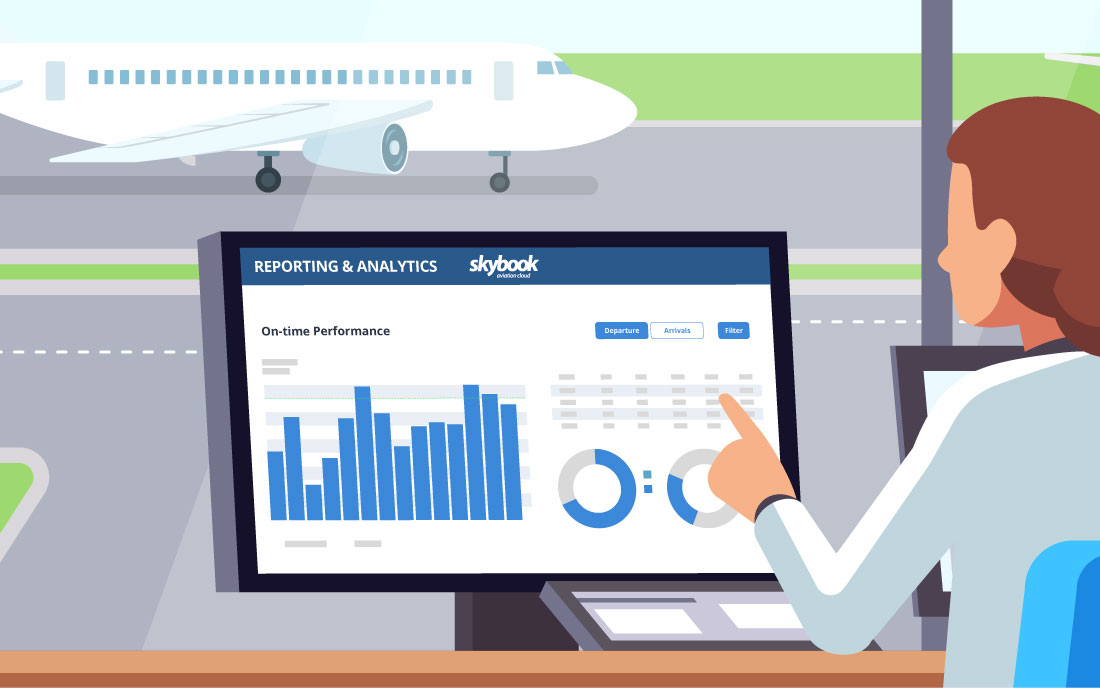
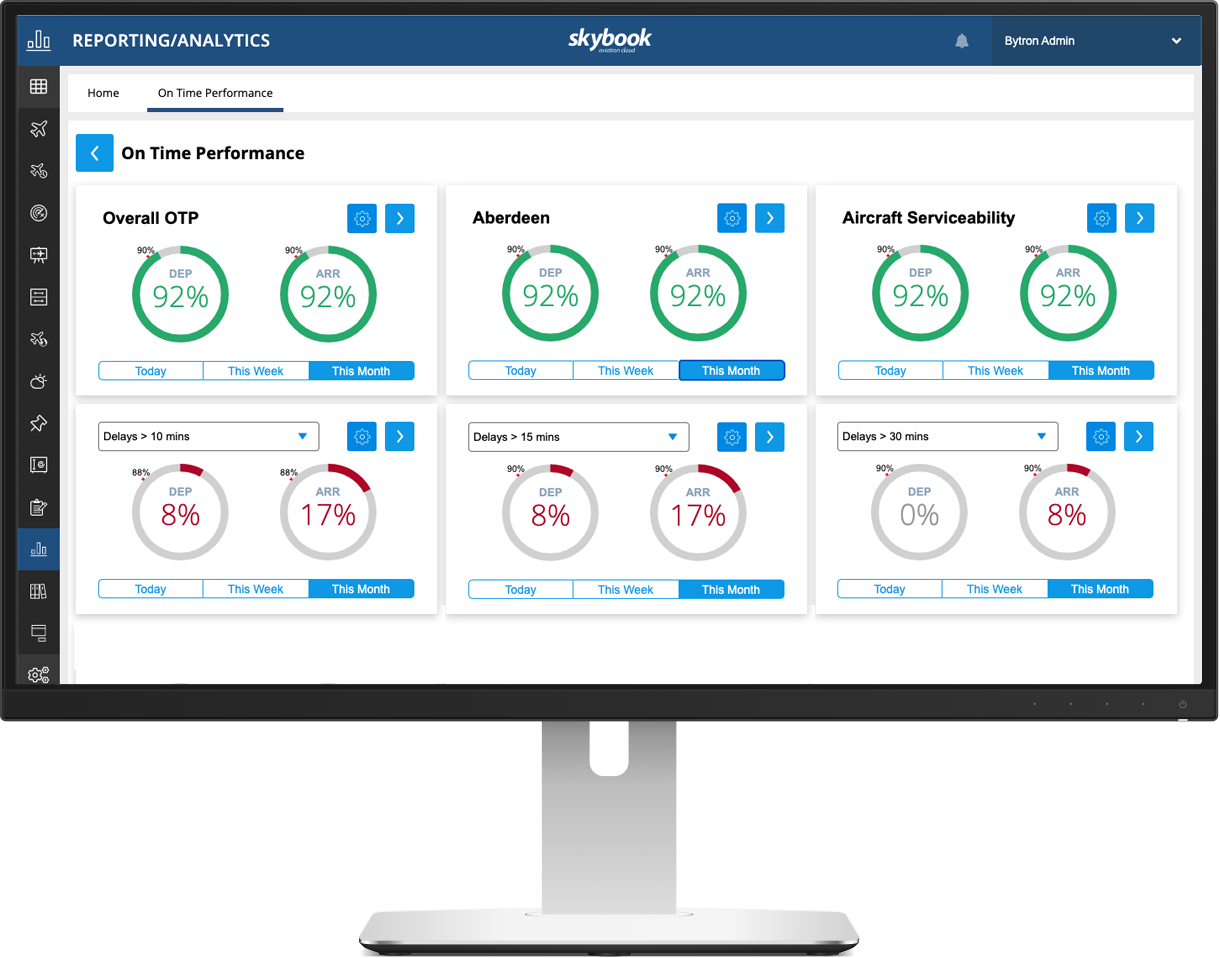
Pulling your data into a visual concept such as a dashboard can help you to see over a given time period the changes in your business.
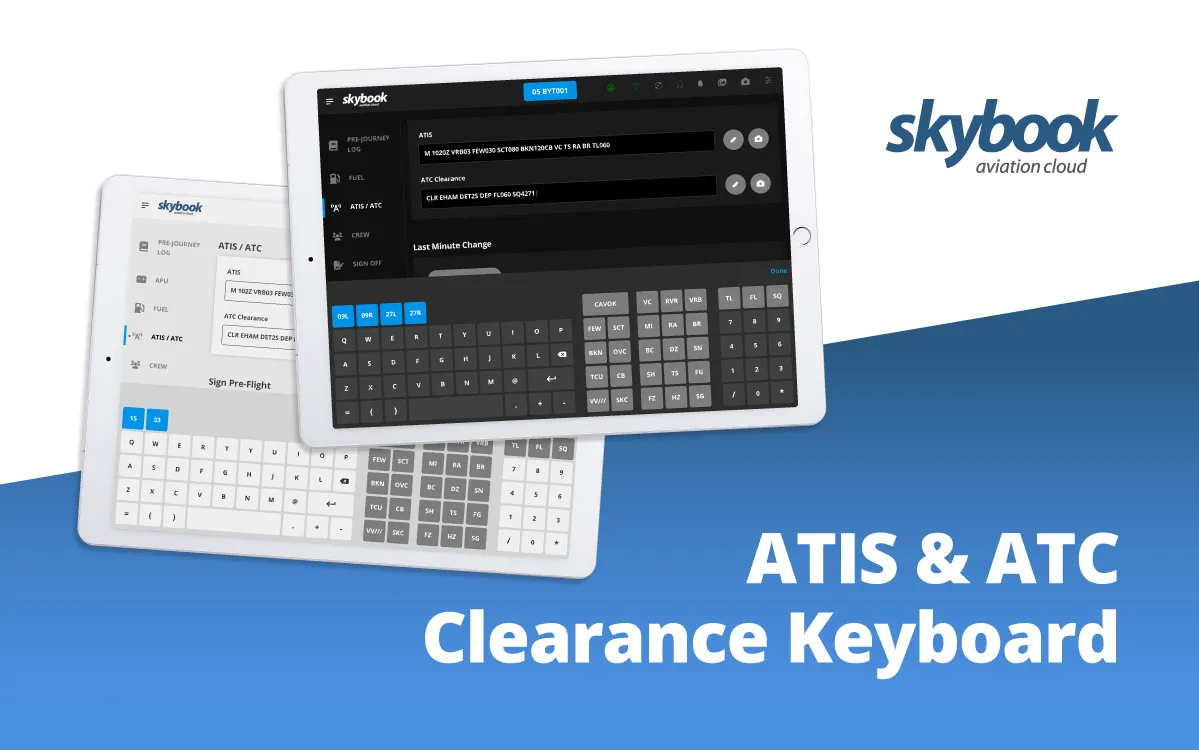
Creating dashboards to visualise your data allows you to see real time information quickly and spot opportunities and issues potentially before they occur. For example, being able to analyse the planned fuel usage against the actual fuel used which can be represented visually for you to check at a glance.
Through understanding patterns in your data you are able to work out how long certain tasks might take and plan for these in the future. Looking at data over a greater time period allows you to see when certain events happen and then you can see the possibility of them happening again in the future.
If you are better equipped for these scenarios, then the customer relationship can be improved and delays reduced.
Dashboards need to be planned well to make the most of the data. You will need to consider the type of dashboard you require. This could be an operational dashboard focusing on day to day activities, flight dispatch dashboard, strategic focusing on Key Performance Indicators or flight analytics drilling down into key insights.
Once you have defined the type of dashboard you can look at the audience and layout. Ensure you are displaying the right information for that audience, whether that is a team or individual.
Your dashboard display needs to be simplistic and easy to view, you don’t want to cram this with too much information which might stop you seeing a key issue.
We asked our Technical Director, Simon Clayton, about his experience regarding data visualisation and looked at how he had helped companies in the aviation industry analyse their data better.
We’ve been able to assist airlines in the past with these similar issues:
We have provided aircraft analytics regarding planned and actual fuel and OTP metrics in order for the airline to reduce their fuel bills and increase their OTP.
Also data such as de-icing activity can be provided to stakeholders immediately ensuring that planned budgets are monitored against reality.
Airlines see benefits in fuel savings, passenger satisfaction and they are able to react more quickly to issues because they have more information to hand.
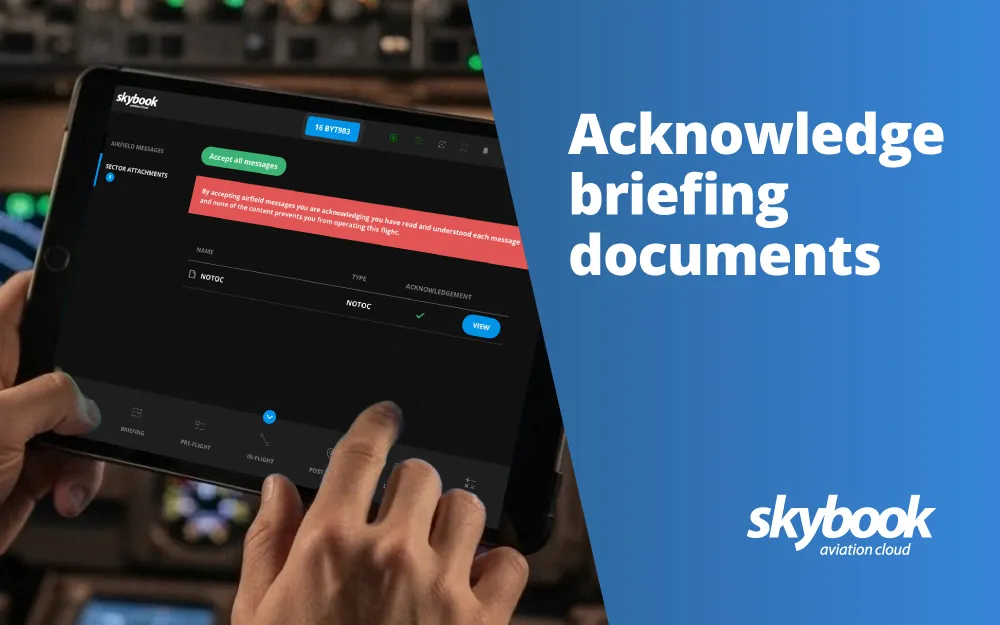
Visibility of information coming back from the flight deck post flight is very slow to filter through to the appropriate stakeholders when a traditional paper-based system is in place.
This stops the airline from pro-actively acting on the information received and putting them at a potential disadvantage against competitors who have this information to hand within a digital system.
If our flight analytics dashboard sounds of interest for aiding in your aviation data visualisation get in touch on the form below.
Why not also subscribe to our latest aviation software news updates.